On this page
Aim: A user wants to be able to be able to generate reports from the result of a network trace.
In this tutorial you will run through configuring a custom network trace report using HTML markdown generated dynamically from features returned in a trace.
This tutorial requires a basic knowledge of HTML. Before starting this tutorial you will need to have created a Utility Network Editor application.
Overview – Dynamic HTML
The Reporting that is demonstrated here uses the capability of the Utility Network Editor application to show HTML as a popup window in the application. A useful reference is the Arcade script used in the configuration of the default “Network Layer Trace Report” that is automatically created in any new UNE application.
In order to generate a report that opens into a new modal (or window), the Launch URL task is configured to transform the features returned from a trace into valid HTML Content.
Walk-through: Configuring a Tailored Trace Report
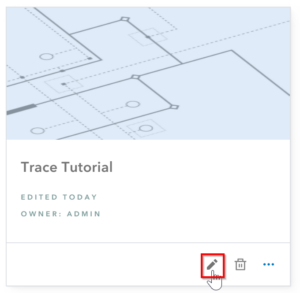
- Navigate to the UNE builder, and click the edit icon (pencil button) for your application.

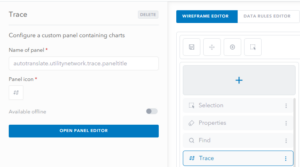
- Click on the Trace Panel. This is a Custom Panel that has been configured by default to contain trace functionality.

- Click the Open panel editor button in the left hand panel.
- Click the Add New button and add a Command element.
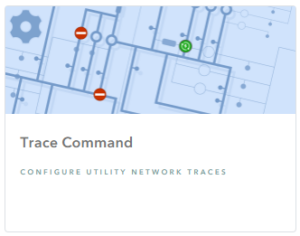
In the default application that is created by UNE, you will see that a “Network Layer Trace Report” Command has already been configured. For this tutorial, you can either ignore or delete this Command.

- In the Appearance tab, provide a name to be displayed in the panel and select Button as the type of Command. An icon can be selected which will appear inside the button alongside the configured name.

- In the Execution tab for the command, click Add to create a new execution task. Provide a Name for the task and select Launch URL. Click on the option that will appear at the bottom of the window to create a “Script to specify a page to show”.

-
Simple Example – Embedded HTML
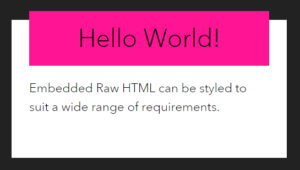
In the script expression, copy and paste the below code into the window. This script will launch a modal window containing some simple HTML content.
Try experimenting with changing the text content and styles of the HTML content.
Once ready, click Ok twice and then save the application.
Note:
- HTML Comments
<!-- comment -->will not be shown on the page - HTML Content is shown inside “ backticks. This is called a template literal and allows for the text to be split over multiple lines.
- It is possible to embed dynamic values inside of the template literal using the
${<variable name>}syntax. style="property:value;..."can be used to add colour, font-size, widths etc. to the html elements.
// Simple HTML Modal // Title variable - this is inserted into the html content template // literal using the ${title} syntax. var title = "Hello World!"; // Html content template literal. var htmlContent = ` <!-- Container --> <div style="position: relative; height: 100%; background: #222;"> <!-- Card --> <div style=" /* set the size and color of the card */ width: 500px; height: 250px; background-color: white; padding: 32px; /* centre the card in the modal */ position: absolute; margin: auto; top: 0px; left: 0px; right: 0px; bottom: 0px; "> <!-- Title --> <h1 style=" /* set the size and color of the header */ background: deeppink; padding: 16px 32px; margin-bottom: 24px; margin-top: -48px; /* set the font properties */ font-size: 3rem; text-align: center; "> ${title} </h1> <!-- Paragraph --> <p style="font-size:1.5rem;"> Embedded Raw HTML can be styled to suit a wide range of requirements. </p> </div> </div> `; return { content: htmlContent, display: "show" } - HTML Comments
- Launch your application. When it has loaded, open the
Tracepanel and click the button for your Trace report. This will launch the simple example HTML content that you created as a modal (pop-up window).At this point the button will always be displayed, though like all actions cannot be clicked whilst the map and layers are in a loading state.

-
Dynamic HTML Content – working with a trace result
In order to configure a report to work against records passed through from a subset of features, such as the results of a network trace, we will need to add logic to the script to work with the global variable $traceresult.
Replace your previous script configured inside the
Launch URL Taskwith the script shown below:
The script uses
FeatureSetByName($traceresult.mapelements, <layer name>)to access the features on the map that were returned in the last run trace for a layer. This FeatureSet is then processed to produce a count of the number of features returned.In this Example we use the “Electric Device” Layer for demo purposes. You will need to replace this with a layer name of a layer that is present within your own Utility Network Webmap.
// Display a simple count of the number of features return from // a network trace. /** Step 1) get the features return from the layer of interest * - in this case the "Electric Device" layer */ // NOTE: change this value to a layer in your map. var foundFeatures = FeatureSetByName($traceresult.mapelements, "Electric Device"); // caclulate the total records selected var countedRecords = Count(foundFeatures); /** Step 2) provide logic to control what content to show * - in this example the number of found records is used to control * which message is shown to the user. */ var paragraph = ""; if (countedRecords == 0) { paragraph = ` <h5 style="font-size: 2rem;"> There are <strong style="color:red">NO</strong> features found 😢 </h5> `; } else { // edit the text to match the network layer that you chose. paragraph = ` <p style="font-size: 1.5rem;"> There are ${countedRecords} Electric Devices found 🥳 </p> `; } var htmlContent = ` <!-- Container --> <div style="position:relative; height:100%; background: #222;"> <!-- Card --> <div style=" /* set the size and color of the card */ width:500px; height:250px; background-color:white; padding: 32px; /* centre the card in the modal */ position:absolute; margin:auto; top: 0px; left: 0px; right: 0px; bottom: 0px; "> <!-- Title --> <h1 style=" /* set the size and color of the header */ background: deeppink; padding: 16px 32px; margin-bottom: 24px; margin-top: -48px; /* set the font properties */ font-size: 3rem; text-align: center; "> Found Network Features </h1> <!-- Paragraph --> ${paragraph} </div> </div> `; return { content: htmlContent, display: "show" }; - Now that the report is set up to work against a result of a network trace, we now need to ensure that the button is not enabled when there is no trace result present.In the builder, go back to the configuration panel for the command that you set up earlier. Click on
Enabledand then the option to add a new script.

- The button will be active when this expression returns true, and disabled when it returns false. The below code demonstrates only activating the report button when a device feature is selected.
Returning “hide” will hide the button completely from the panel.
/** Control display of trace report * * Only enable the trace report form when there is a trace * result available. * */ // disable if no trace result if ($traceresult == null) { return false; // return "hide" to hide the button completely. } // disable if a trace is currently being run if ($traceresult.isrunning == true) { return false; } // disable if the last trace failed to return a valid result if ($traceresult.success == false) { return false; } // disable if the trace returned no features in the map. if ($traceresult.mapelements == null) { return false; } // otherwise enable the button. return true; - Launch your application again. When it has loaded go to the trace panel and you will notice that the button is initially disabled. Now run a trace on a small portion of your network. Once the trace has completed successfully and selected some features on the map the button will become activated. Click on the Trace Report tab and then the button for your report. This will launch the HTML page and will run the script to display the number of features returned for the network layer that was configured.

-
Trace Report – Table of data with Print and Export
In this section we will turn the returned trace result into a table and report which can be exported or printed from the modal window. To do this we will be using the same technique as above to access the returned features, and then will process these results into a valid table format.
The example uses functions defined in the Arcade Script (
generateTableHeaderRows()andgenerateTableRows()) to generate the html for the Table headers and rows from the returned trace result.It is also possible to run commands that export a csv or print sections of the generated HTML report using commands triggered from buttons inside the embedded HTML.
The below script can be altered by changing the layers that are referenced, as well as by changing the fields which appear in the table.
/** Trace Report Html Page Configuration
 *
 * This default report is configured to:
 *  1) Generate a simple arcade html report for a selected
 *     network layer.
 *  2) Allow the user to print the report.
 *  3) Allow the user to export the data in the report.
 *
 * The arcade can be modified to alter the behaviour and look and feel
 * of the report.
 *
 */

/**------------------------------------------------------------
 * Step 1: Defining Styling Information - Theming the report
 *
 * Colors:
 * This section references theme colors from the main application. The
 * background colours stand-out against their corresponding text colors.
 *
 * Styles:
 * In Arcade it is not possible to define new CSS styles. Instead syling
 * must be applied via the style attribute to HTML elements being rendered.
 *
 * -----------------------------------------------------------*/

/** ######### COLOURS ###########
*  Note:
* - Color variables can replaced with any hex values
*/

//***** Sweet Main Theme Color *****/
var app_MainTheme_Color = `var(--color-theme-theme-color)`;

// panel background color
var reportBody_Background_Colour = `var(--color-theme-panel-bg)`;
var reportBody_Text_Colour = `var(--color-theme-panel-text)`;

// alert background color will stand out against panel.
var table_Background_Colour = `var(--color-theme-alert-bg)`;
var table_Text_Colour = `var(--color-theme-alert-text)`;

// aside (Side Bar Ribbon) background color
var banner_Background_Colour = `var(--color-theme-aside-bg)`;
var banner_Text_Colour = `var(--color-theme-aside-text)`;

// header (Top Bar Ribbon) background color
var Header_Background_Colour = `var(--color-theme-header-bg)`;
var Header_Text_Colour = `var(--color-theme-header-text)`;

//######### HTML STYLING OF ELEMENTS ###########
var reportWrapper = `
height:100%;
background-color: ${reportBody_Background_Colour};
color:${reportBody_Text_Colour};
`;

var topBarWrapper = `
padding:16px 24px;
background-color: ${banner_Background_Colour};
color: ${banner_Text_Colour};
display:flex;
align-items:center;
justify-content:start;
column-gap:16px;
`;

var headerTitleWrapper = `
padding:24px 48px;
background-color: ${Header_Background_Colour};
color: ${Header_Text_Colour};
`;

var tableWrapper = `
display:flex;
min-width:100%;
padding:24px;
flex-direction:column;
`;

var tableCommandsWrapper = `
display:flex;
justify-content:space-between;
padding-bottom:8px;
`;

var tableHeaderRow = `
font-size:1rem;
padding:8px 24px;
color:${banner_Text_Colour};
`;

/**------------------------------------------------------------
 * Step 2) Process Trace results and Generate HTML Report Content
 *
 * In this section the results of a trace are transformed into
 * HTML rows within a table.
 *
 * The results are combined with customisable text parameters which
 * define parts such as the header of the report.
 * -----------------------------------------------------------*/

// FeatureSet based on last trace results.
// (in this case the "Electric Device" layer)
// Note: change this value to a layer in your map.
 var inputFeatures = FeatureSetByName($traceresult.mapelements, "Electric Device")

 // Name of the last run trace type.
 var nameOfLastRunTrace = $traceresult.trace.name

 // ****Column Headers ****
 // Column Headers for data in report table.
 // This MUST match the ORDER and NUMBER of attributes in each recordRow html array
 var tableHeaders = [
     "Asset ID",
     "Asset Group",
     "Asset Type"
   ];


 // Generate the column headers HTML content:
 function generateTableHeaderRows(tableHeaders){
     var htmlTableHeader =""
     for(var title in tableHeaders){
         var newCol = `
             <th scope="col" style="${tableHeaderRow}">
                 ${tableHeaders[title]}
             </th>
         `
         htmlTableHeader += newCol
     }

     return htmlTableHeader
 }

 // ***** Generate Table Rows *******
 // A function for generating table HTML Table Rows.
 // - The function takes in a fatureset as an argument and produces a row for
 //   each feature.
 // - <tr> represents a table row.
 // - <td> represents a table data cell.
 function generateTableRows(inFeatureset){
     var htmlTableRows =""
         for(var feat in inFeatureset){
             // find assettype and assetGroup metadata for feature.
             // this allows the string name to be decoded for the feature.
             var feattypesinfo = assettypemetadata(feat);
             var newRow = `
                 <tr>

                     <!-- Unique Global ID -->
                     <td class="px-6 py-4 whitespace-nowrap">
                         <div class="text-sm text-sweet-theme-color">${feat.assetid}</div>
                     </td>

                     <!-- Asset Group -->
                     <td class="px-6 py-4 whitespace-nowrap">
                         <div class="text-sm text-sweet-theme-color">${feattypesinfo.assetgroupname}</div>
                     </td>

                     <!-- Asset Type -->
                     <td class="px-6 py-4 whitespace-nowrap">
                         <div class="text-sm text-sweet-theme-color">${feattypesinfo.assettypename}</div>
                     </td>

                 </tr>
             `
             htmlTableRows += newRow
    }
    return htmlTableRows;
}

// Time for which the report was generated
var currentDateTime = Text(Timestamp(), 'HH:mm, MMMM D Y');

// Top Title Bar
var topTitleBar = "Trace Report";

// Top sub-Title Bar
var topSubTitleBar = "Utility Network Editor";

// Report Header text
var reportHeader = "Selected Features:";

// Report text description
var reportText = `The following network assets from the
  Electric Device layer have been selected by a
  ${nameOfLastRunTrace} trace. The trace report was generated
  at ${currentDateTime}`;

 /**------------------------------------------------------------
 * Step 3: Defining Report Custom Commands
 *
 * In this section the commands that allow data to be exported or
 * the report to be printed are defined.
 *
 * -----------------------------------------------------------*/

// Convert input features into a csv format
var csvDataForExport = CSV(inputFeatures);

// ***** Export CSV Command *******
// Encoded HTML Attribute for exporting a featureSet.
// The csv parameter must contain the csv content to be exported.
var exportCsvCommand = EncodeHtmlAttribute(Text({
    command: "export-csv",
    csv: csvDataForExport,
}));

// ***** Print Command *******
// Encoded HTML Attribute for printing a section of the html.
// The print ID attribute is placed on the html element (and it's content)
// that will be printed.
var printId = "Report";
var printCommand = EncodeHtmlAttribute(Text({
    command: "print-html",
    printid: printId,
}));

 /**------------------------------------------------------------
 * Step 4: return the generated HTML to display:
 *
 * The script returns a dictionary containing information about the
 * content to display and the method of showing it.
 *
 * - content: This is a string containing the HTML content to be
 *            displayed. This is usually a arcade template literal (``)
 *            in which sections of data are inserted via the ${variable}
 *            syntax into the string.
 *
 * - display: This is set to "show" or "launch". Using show will display
 *            the content as a modal in the application.
 *
 * If there are too many features or no features selected in a layer,
 * then return an error.
 * -----------------------------------------------------------*/

if (Count(inputFeatures) == 0) {
    return {
        error: "No assets were returned for this network layer"
    };
}

if (Count(inputFeatures) > 1000) {
    return {
        error:"There are too many assets returned to show in a report"
    };
}

// Generate and return the HTML report
return {
    content: `
    <!-- Report Wrapper -->
    <div printid="Report" style="${reportWrapper}">

        <!-- Nav bar at top of page -->
        <div style="${topBarWrapper}">
            <!-- Network Icon -->
            <svg height="24" width="24" viewBox="0 0 24 24" xmlns="http://www.w3.org/2000/svg"
                class="text-sweet-aside-text">
                <path d="M0 0h24v24H0z" fill="none"></path>
                <path
                    d="M4 15V8.5a4.5 4.5 0 0 1 9 0v7a2.5 2.5 0 1 0 5 0V8.83a3.001 3.001 0 1 1 2 0v6.67a4.5 4.5 0 1 1-9 0v-7a2.5 2.5 0 0 0-5 0V15h3l-4 5-4-5h3zm15-8a1 1 0 1 0 0-2 1 1 0 0 0 0 2z"
                    fill="currentColor"></path>
            </svg>

            <!-- Main Title -->
            <div style="font-size:1.5rem;">
                ${topTitleBar}
            </div>

            <!-- Sub Title -->
            <div style="font-size:1.25rem; max-width:50%">
                ${topSubTitleBar}
            </div>
        </div>

        <!-- Header Banner Section -->
        <div style="${headerTitleWrapper}" class="shadow">
            <h1 style="font-size: 3rem; margin-bottom:8px; color: ${app_MainTheme_Color};">
                ${reportHeader}
            </h1>
            <p style="margin-bottom:8px">
                ${reportText}
            </p>
        </div>

        <!-- Table wrapper -->
        <div style="${tableWrapper}">
            <div style="${tableCommandsWrapper}">
                <h2 style="margin: 0;font-size: 1.5rem;align-self:center;">
                    Results
                </h2>
                <div>
                    <div data-run-commands="${printCommand}" class="btn btn-outline-primary print:hidden">Print</div>
                    <div data-run-commands="${exportCsvCommand}" class="btn btn-outline-primary print:hidden">Export</div>
                </div>
            </div>

            <div class="min-w-full">
                <div class="
                    shadow
                    overflow-x-auto
                    border-b
                    border-sweet-panel-border
                    min-w-full
                    ">
                    <table class="min-w-full">
                        <thead style="background-color:${banner_Background_Colour}">
                            <tr>
                                ${generateTableHeaderRows(tableHeaders)}
                            </tr>
                        </thead>
                        <tbody style="background-color:${table_Background_Colour}" class="divide-y divide-sweet-panel-border">
                            ${generateTableRows(inputFeatures)}
                        </tbody>
                    </table>
                </div>
            </div>
        </div>
    </div>
     `,
    display: "show"
};
Creating Advanced Custom Reports
The capability of the Utility Network Editor application to launch HTML pages means that it is simple and easy to create completely custom reports which can hook into your own organisation’s systems and databases. For example, the command script can launch a separately hosted HTML page using HTML GET or POST parameters, and is capable of two-way communication via a “Pipe” protocol.
The command script is also able to call external URLs and APIs using a WebHook Function, and therefore can be set up to access an external asset management system via feature information on the map, to include additional details for the final report.
