On this page
Aim: As an administrator I want to provide network tracing functionality for users of a UNE application.The trace configuration that is demonstrated here uses the capability of the Utility Network Editor application to configure custom tracing.
In this tutorial you will configure tracing functionality by adding trace configuration settings to an application. Before you start this tutorial you will need to have created a UNE application.
Adding a Trace Configuration
Trace configurations are added / removed on the Trace Widget. The trace widget can be added to a custom panel. The default UNE application has a custom panel called Trace, where this widget has been added.- Navigate to the UNE builder.
- Click the edit icon (pencil button) for your application.
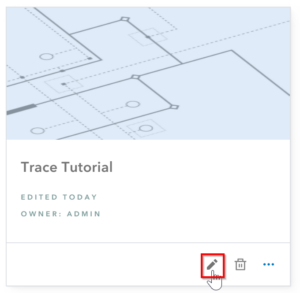
- Open the “Trace” panel editor.
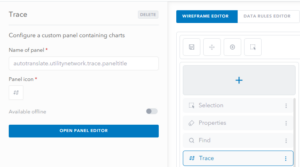
- Click the “Open panel editor” button in the left-hand panel.
- Click the “Perform Trace” button.
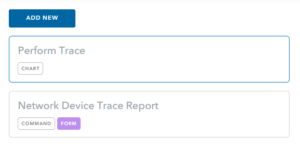
- Expand the “Trace Types” section in the left-hand panel and then click the “Add Trace” button.
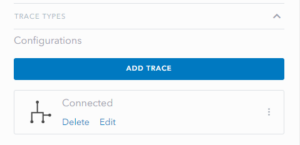
- Fill in the details of the trace you wish to configure. These settings are broadly the same as documented for the trace geoprocessing task.

- Click the OK button in the Edit trace configuration dialog, then click the “Save” button at the top of the builder window.
Testing the Trace Configuration
- Launch your application by clicking the Launch button at the top of the builder window.
- Create a new starting point at the place on your network where you would like to start a new Connected trace. To do this, use the ‘Create’ tool on the main toolbar. If the current feature type being created is not a
Starting Point, click the Choose button next to the Create tool. PickStarting Pointfrom the Trace Locations section, in the panel that opens. - If required, create barriers, using the same Create tool. It will be necessary to pick use the Choose button, to select a
Barrierfeature type. - Click the Trace button, then select your newly configured trace from the Type of Trace drop down.
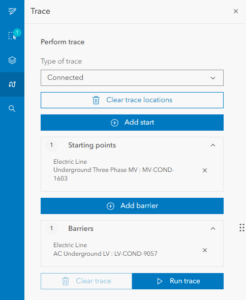
- Click Run trace. The trace will run and the features included in the trace will be highlighted on the map and show in the Selection panel.
Adding the Trace Results Widget
The trace results widget allows users to see the results of a trace in a tabular format.- Open the Trace panel editor.

- Click the Open panel editor button in the left-hand panel.
- Click the add new button and select the Trace Result option
- In the Trace Results chart settings choose when the trace results widget will appear.
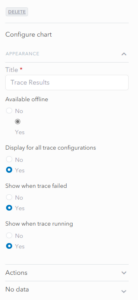
- With the trace result widget, actions can be set. These are offered to the user as optional commands they can run on individual result features. For example launching an external link to an asset management system to get further details about a network asset.
